May 23, 2023 No Comments Geoserver图层SLD样式编辑问题 ## 一、线上地图样式 SLD:风格化图层描述器(Styled Layer Descriptor)的简称,是2005年OGC提出的一个标准[样式层描述符](http://www.opengeospatial.org/standards/sld "样式层描述符"),这个标准在一定条件下允许WMS服务器对地图可视化的表现形式进行扩展。在没有SLD之前,只能使用一些已经在服务器上规定好的样式来对地图进行可视化。而当使用了实现了SLD标准之后,它允许我们从客户端来对地图进行定义自己的样式,分级显示等操作,极大的扩展了地图可视化的灵活性。SLD用于后端渲染图层给前端返回栅格数据。 Mapbox Style:定义地图视觉外观的文档,要绘制哪些数据、绘制地图的顺序以及绘制数据时如何对数据进行样式。样式文档是具有特定根级和嵌套属性的JSON对象。此规范定义并描述这些属性。Mapbox Style用于前端渲染图层,后端只返回矢量切片数据。 Geoserver图层样式使用的是OGC标准的SLD文件,其对初学者学习成本高,学习难度大,如果有类似Mapbox的mapbox studio、百度地图的个性化地图编辑器、高德地图的自定义地图编辑器将大大提高地图制图效率。相关文章《[让maputnik支持geoserver](https://blog.csdn.net/gisarmory/article/details/116401076 "让maputnik支持geoserver")》。 ## 二、SLD样式编辑软件 ## 1.QGIS 一个开源的GIS桌面软件,具有丰富的地图样式编辑,功能强大,能够生成SLD文件。 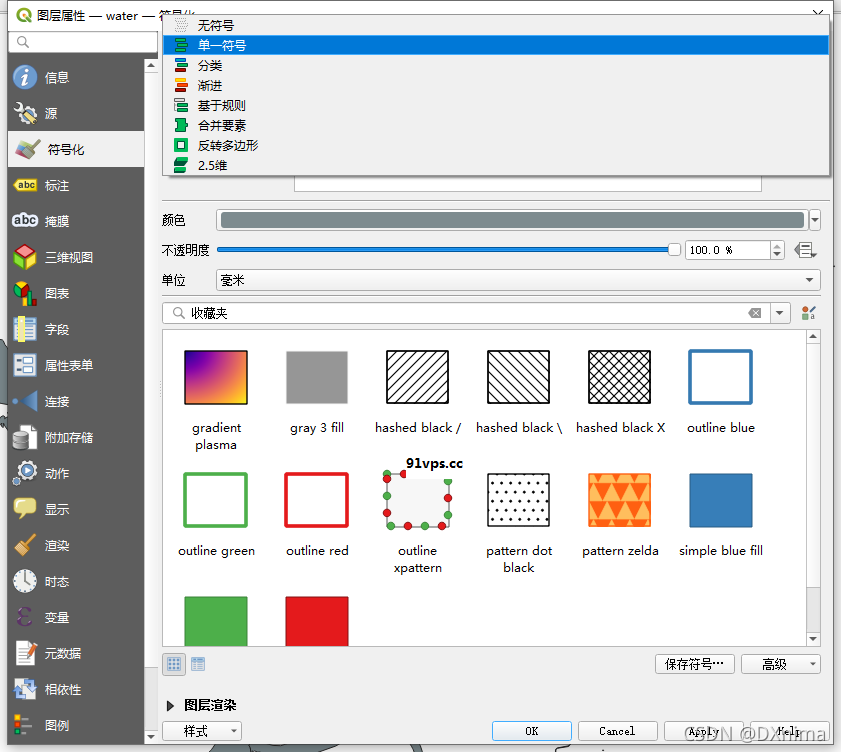 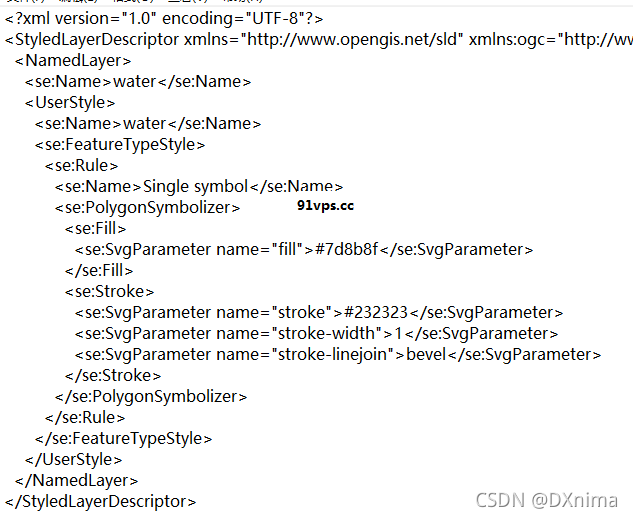 ## 2.udig 一个基于Java开发的GIS桌面应用程序,其样式编辑功能没有QGIS强,界面操作上比QGIS简单,能够生成SLD文件,但部分样式参数无法编辑需要自行编写SLD,而且加载大数据量的数据软件容易崩溃。 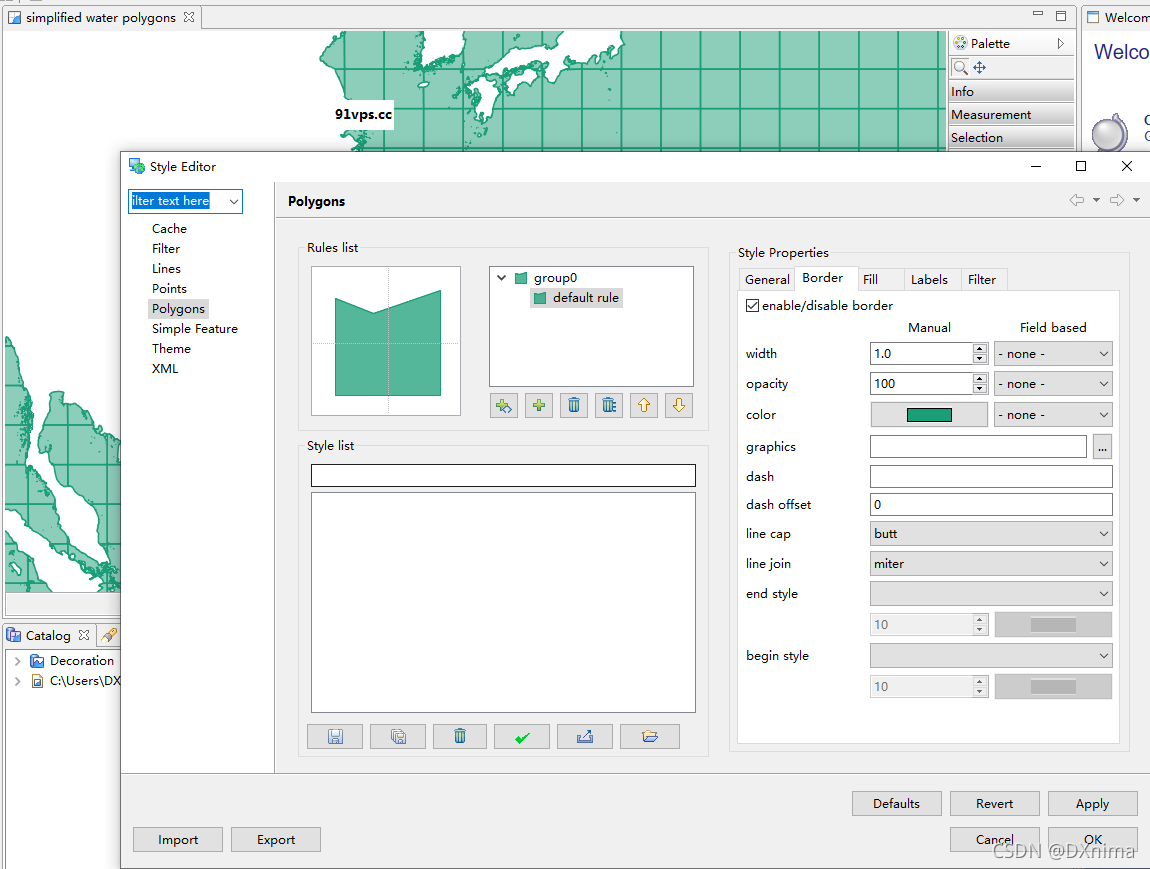 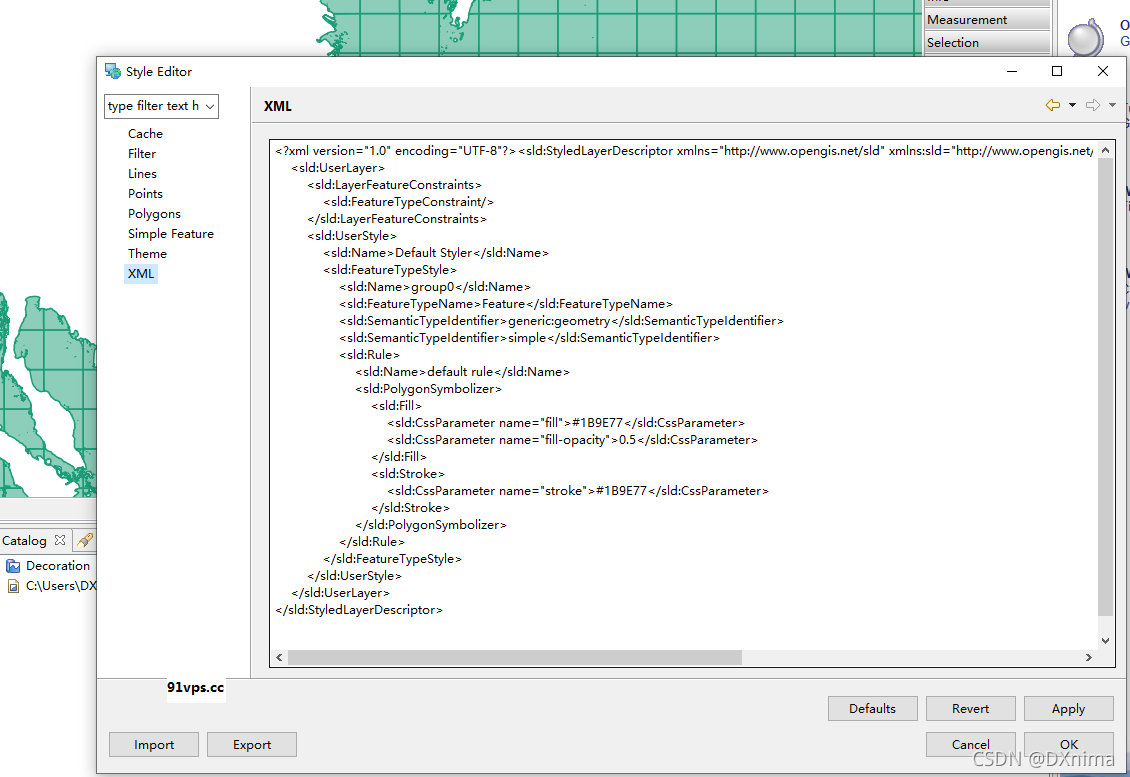 ## 3.SLDEditor 编辑地图样式的 Java 桌面应用程序,允许使用图形用户界面以交互方式创建和编辑[OGC 样式层描述符](http://www.opengeospatial.org/standards/sld "OGC 样式层描述符")。能生成SLD文件,可以完全控制OGC SLD标准的所有方面;但是无法加载空间数据,对比着调节样式及时查看效果;相比前两个软件,这个更像是一个SLD可视化编辑工具。 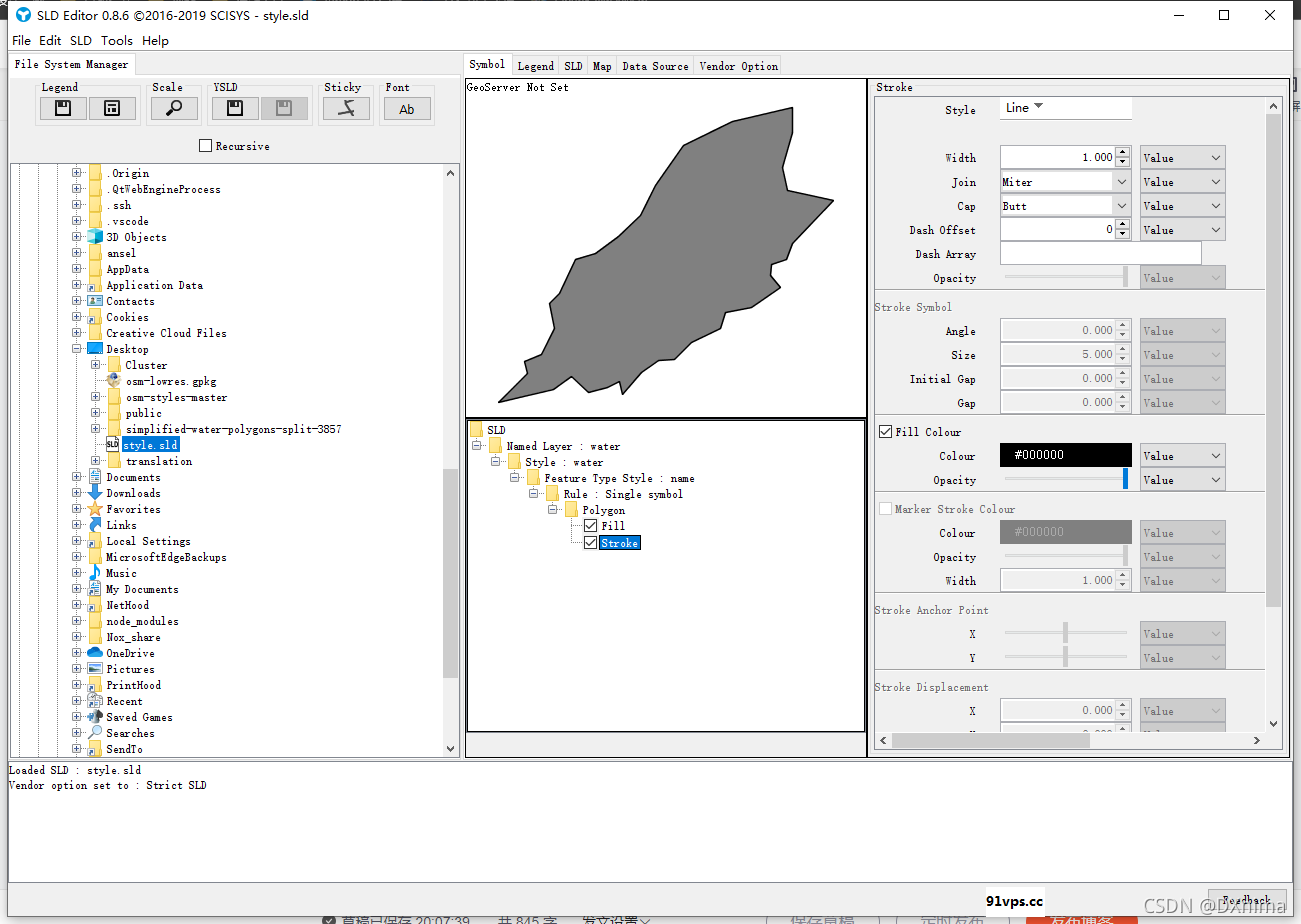 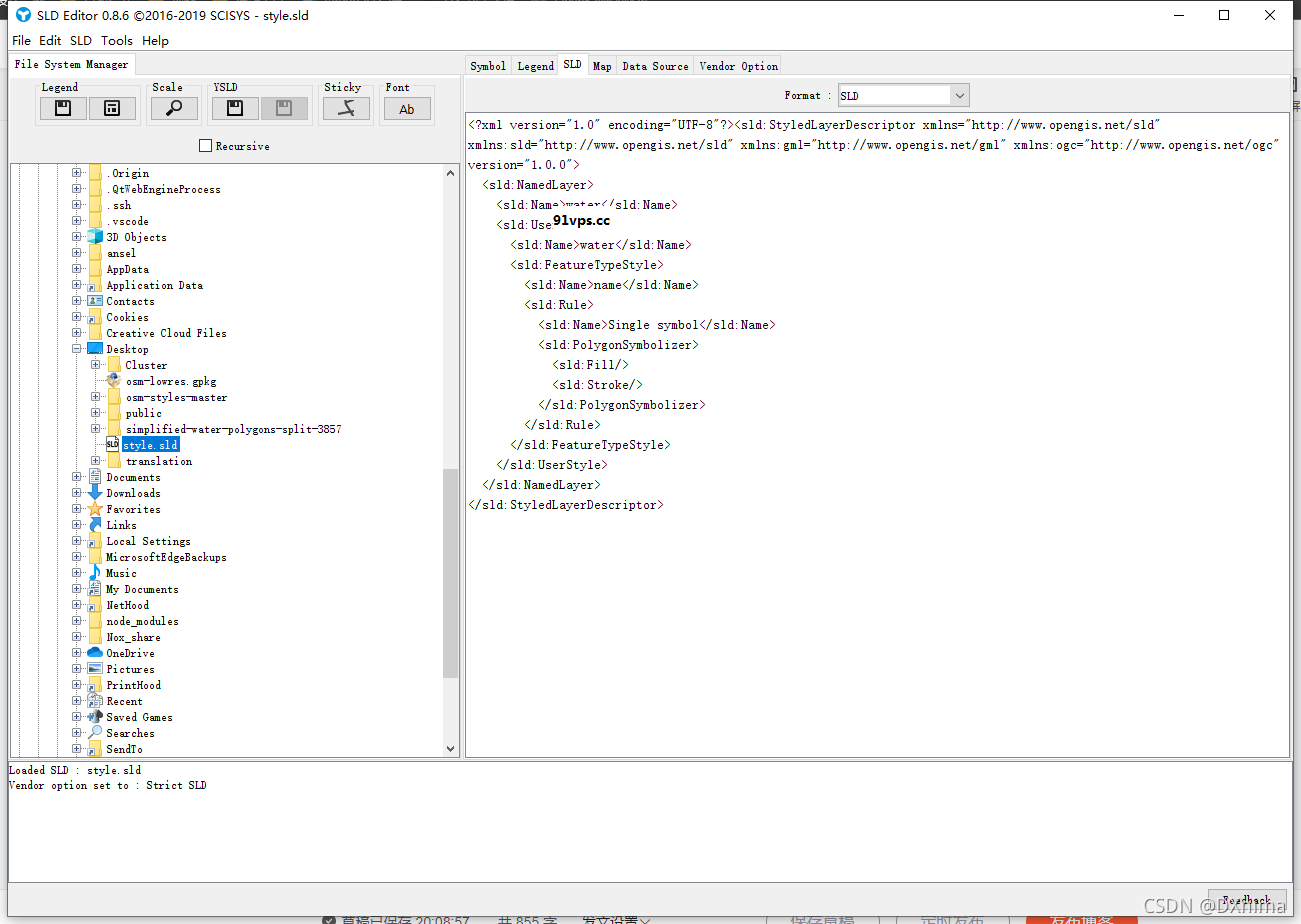 ## 三、使用maputnik调节自定义样式 通过网上搜索查看了《[让maputnik支持geoserver](https://blog.csdn.net/gisarmory/article/details/116401076 "让maputnik支持geoserver")》这篇博客,发现这就是我想要的工具,一个类似百度、高德地图那样的矢量地图配图工具,比起前面的桌面软件调节样式这个更轻,功能更强大,操作更友好。不过前提条件Geoserver需要安装两个插件: + [Vector Tiles](http://sourceforge.net/projects/geoserver/files/GeoServer/2.19.2/extensions/geoserver-2.19.2-vectortiles-plugin.zip "Vector Tiles") (支持maobox矢量切片插件) + [MBStyle Styling](http://sourceforge.net/projects/geoserver/files/GeoServer/2.19.2/extensions/geoserver-2.19.2-mbstyle-plugin.zip "MBStyle Styling")(支持Mapbox样式文件插件) ## 1.插件安装 下载Geoserver对应版本的插件Vector Tiles、MBStyle Styling,将解压安装包中的所有jar包放在**.../webapps/geoserver/WEB-INF/lib**目录下,重启Geoserver,在编辑图层中Tile Caching标签页看到“**application/vnd.mapbox-vector-tile**”说明Vector Tiles插件安装成功,新建样式文件Format下拉框看到“**MBStyle**”说明MBStyle Styling插件安装成功。 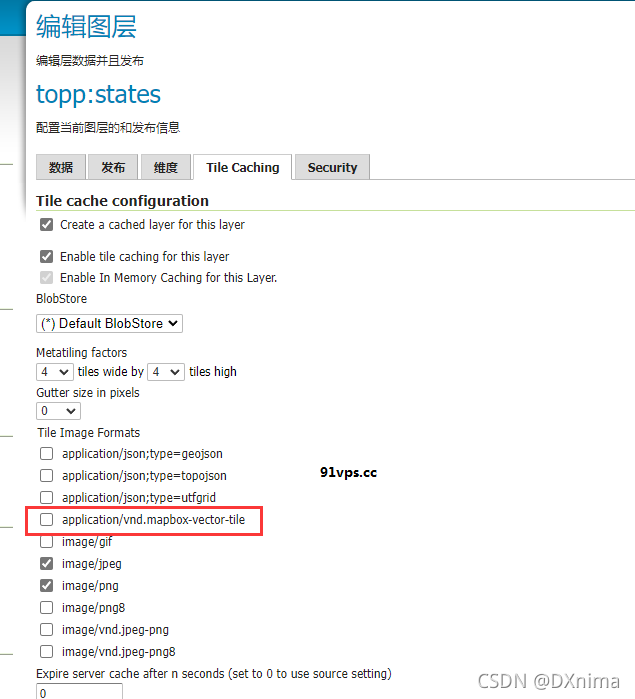 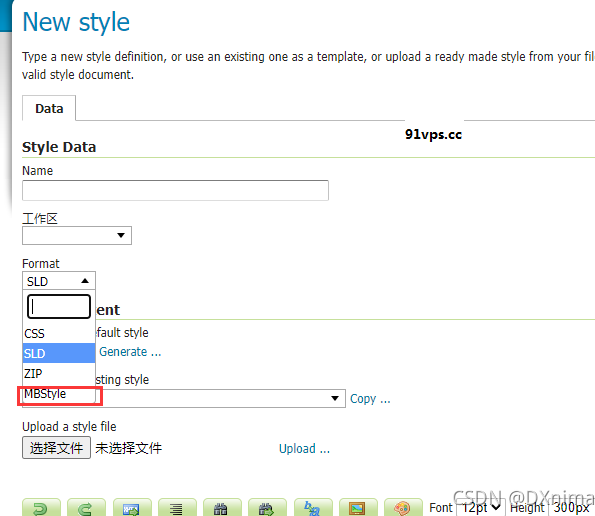 ## 2.设置图层开启矢量切片 将[OSM地图本地发布(四)-----Geoserver发布自定义地图](https://blog.csdn.net/qq_40953393/article/details/120608112 "OSM地图本地发布(四)-----Geoserver发布自定义地图")中的“taiwan”图层组开启矢量切片功能。 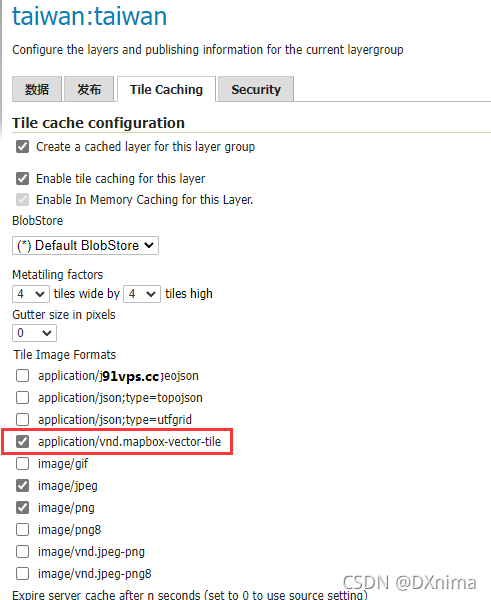 查看矢量切片链接,打开Geoserver首页点击TMS: 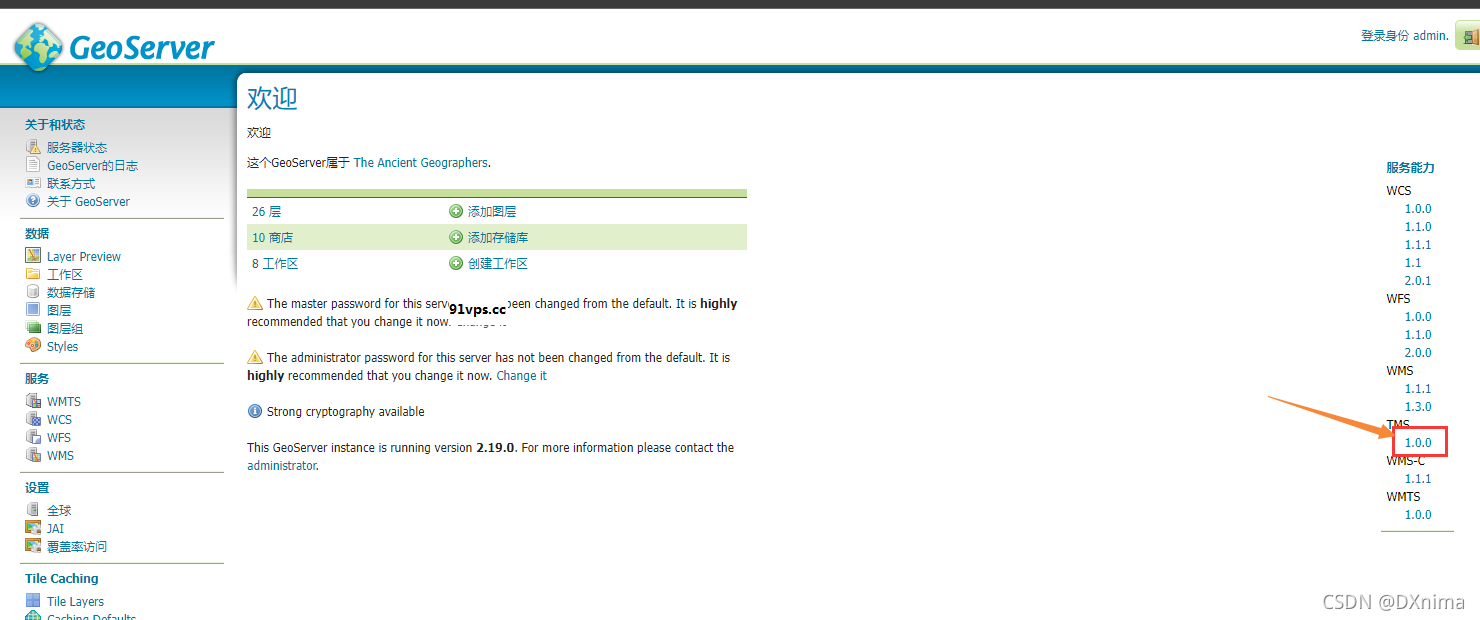 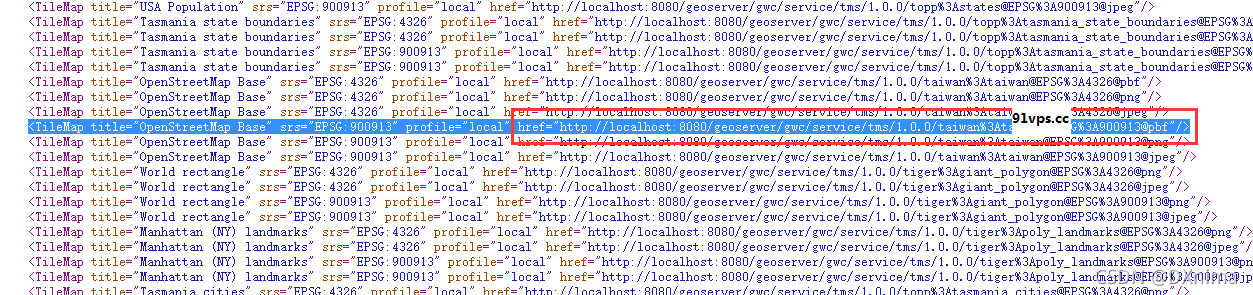 **900913@pbf**链接为maputnik要用的链接,因为mapbox style只支持谷歌Web墨卡托投影EPSG:900913 ```auto http://localhost:8080/geoserver/gwc/service/tms/1.0.0/taiwan%3Ataiwan@EPSG%3A900913@pbf ``` ## 3.使用maputnik打开图层 不会使用的先看 《[让maputnik支持geoserver](https://blog.csdn.net/gisarmory/article/details/116401076 "让maputnik支持geoserver")》这篇博客、[Mapbox Style官方文档](https://docs.mapbox.com/mapbox-gl-js/style-spec/layers/#fill "Mapbox Style官方文档"),这里提供一个json样式模板,其中tiles中的链接即为前面TMS中看到的链接,source为设置的数据源,source-layer为数据源中各个图层的名字,即taiwan图层组中的各个图层的名字: ```javascript { "version": 8, "name": "Taiwan Liberty", "metadata": {"maputnik:renderer": "mbgljs"}, "center": [120.679882, 24.143171], "zoom": 4, "sources": { "taiwan": { "type": "vector", "scheme": "tms", "tiles": [ "http://localhost:8080/geoserver/gwc/service/tms/1.0.0/taiwan%3Ataiwan@EPSG%3A900913@pbf/{z}/{x}/{y}.pbf" ], "minZoom": 0, "maxzoom": 24 } }, "sprite": "https://maputnik.github.io/osm-liberty/sprites/osm-liberty", "glyphs": "https://api.maptiler.com/fonts/{fontstack}/{range}.pbf?key={key}", "layers": [ { "id": "background", "type": "background", "layout": {"visibility": "visible"}, "paint": {"background-color": "#F2EFE9"} }, { "id": "其他-海洋", "type": "fill", "source": "taiwan", "source-layer": "simplified_water_polygons", "layout": {"visibility": "visible"}, "paint": {"fill-color": "#AAD3DF"} }, { "id": "其他-建筑物", "type": "fill", "source": "taiwan", "source-layer": "building", "minzoom": 0, "maxzoom": 24, "paint": { "fill-color": "#DCD9D6", "fill-outline-color": { "base": 1, "stops": [[13, "hsla(35, 6%, 79%, 0.32)"], [14, "hsl(35, 6%, 79%)"]] } } }, { "id": "水域", "type": "fill", "source": "taiwan", "source-layer": "water", "minzoom": 0, "maxzoom": 24, "layout": {"visibility": "visible"}, "paint": {"fill-color": "#B2CEFE"} }, { "id": "水域-边界", "type": "line", "source": "taiwan", "source-layer": "water_outline", "minzoom": 0, "maxzoom": 24, "paint": {"line-color": "#B2CEFE"} }, { "id": "水域-河流", "type": "line", "source": "taiwan", "source-layer": "river", "minzoom": 0, "maxzoom": 24, "layout": {"visibility": "visible"}, "paint": {"line-color": "#B2CEFE", "line-width": 1} }, { "id": "公路-line", "type": "line", "source": "taiwan", "source-layer": "route_line", "minzoom": 0, "maxzoom": 24, "layout": {"line-join": "round", "line-cap": "round"}, "paint": {"line-color": "#4A83BF", "line-opacity": 0.6, "line-width": 0.4} }, { "id": "地名-city", "type": "symbol", "source": "taiwan", "source-layer": "placenames_medium", "minzoom": 0, "maxzoom": 24, "layout": { "text-field": {"type": "identity", "property": "name"}, "text-size": 12, "text-allow-overlap": false, "text-ignore-placement": false, "text-font": ["SimSun Regular"] }, "paint": { "text-halo-color": "#FFFFFF", "text-opacity": 1, "text-halo-width": 1 } } ], "id": "taiwan_liberty" } ``` ## 4.使用maputnik调节样式 这里提供一个完整的样式文件,链接: https://pan.baidu.com/s/1qbVC5Jbsa42rbP-p\_i5XxQ 提取码: w2pf,文件中的**taiwan.json**为样式文件。 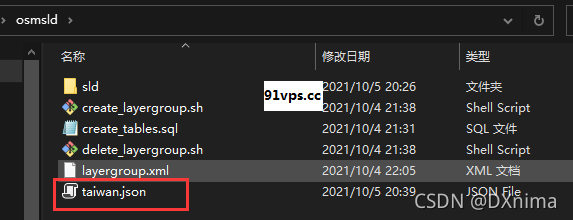 打开maputnik将taiwan.json文件导入,即可进行样式调节。 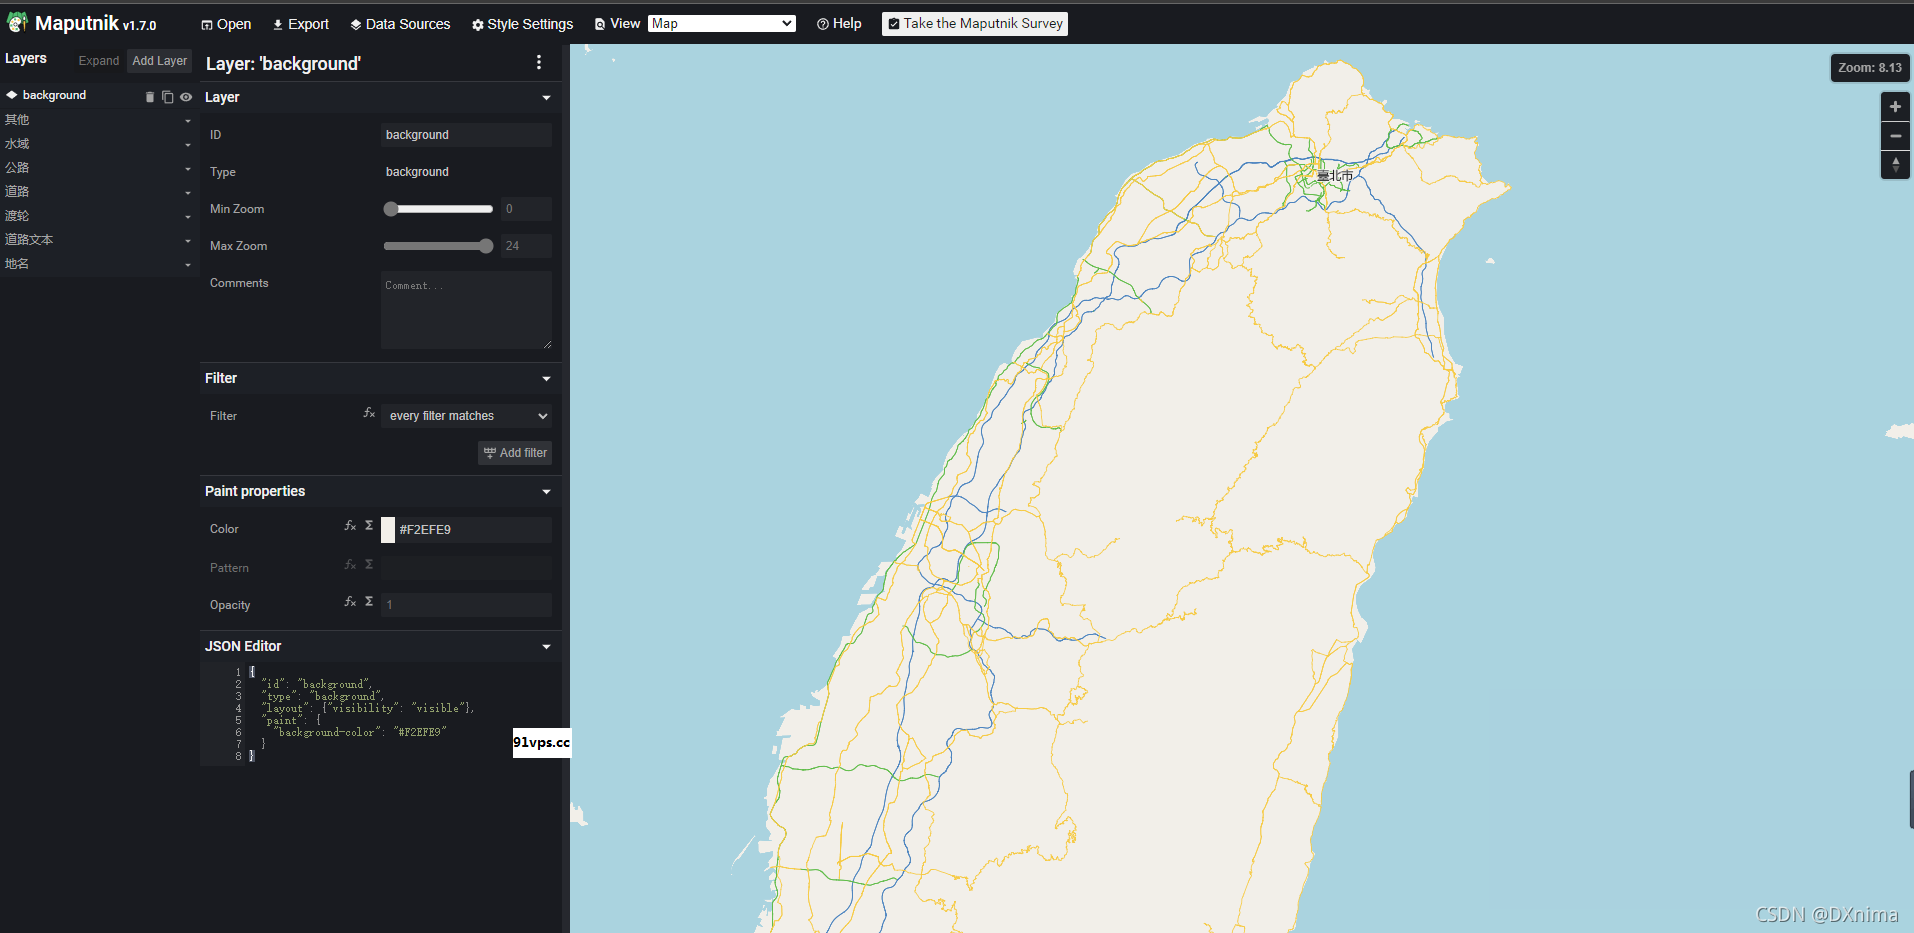 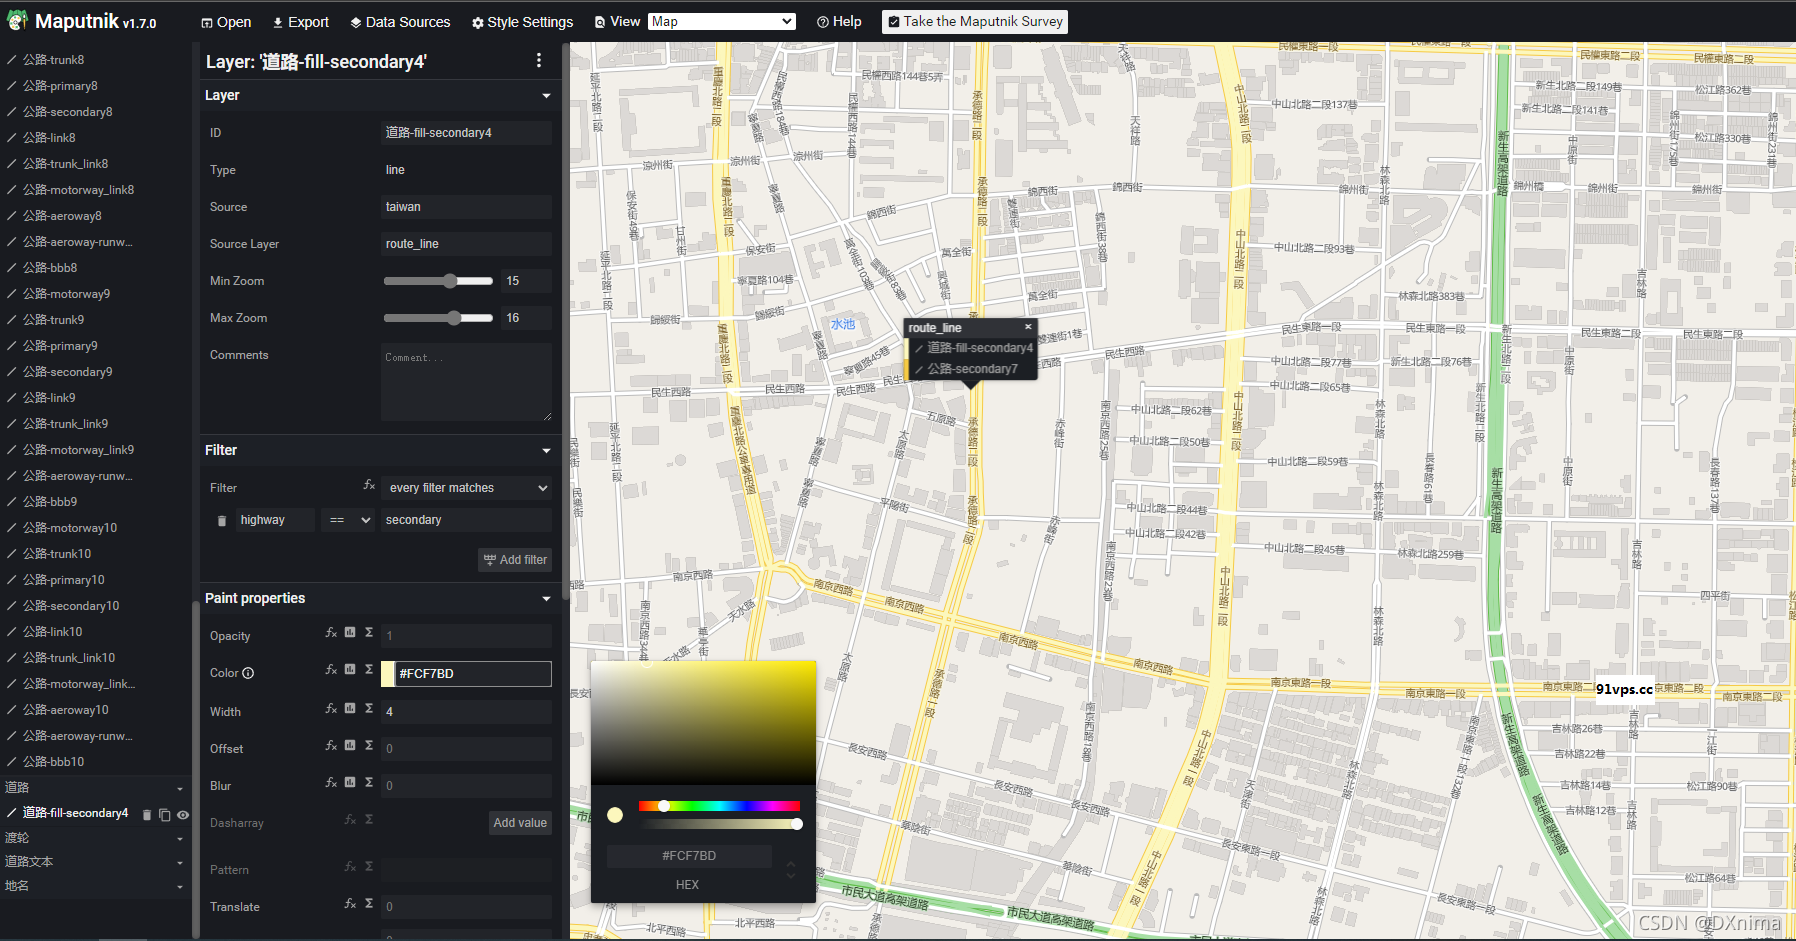 ## 四、Mapbox样式转为SLD ## 1.导出maputnik调节好的样式文件 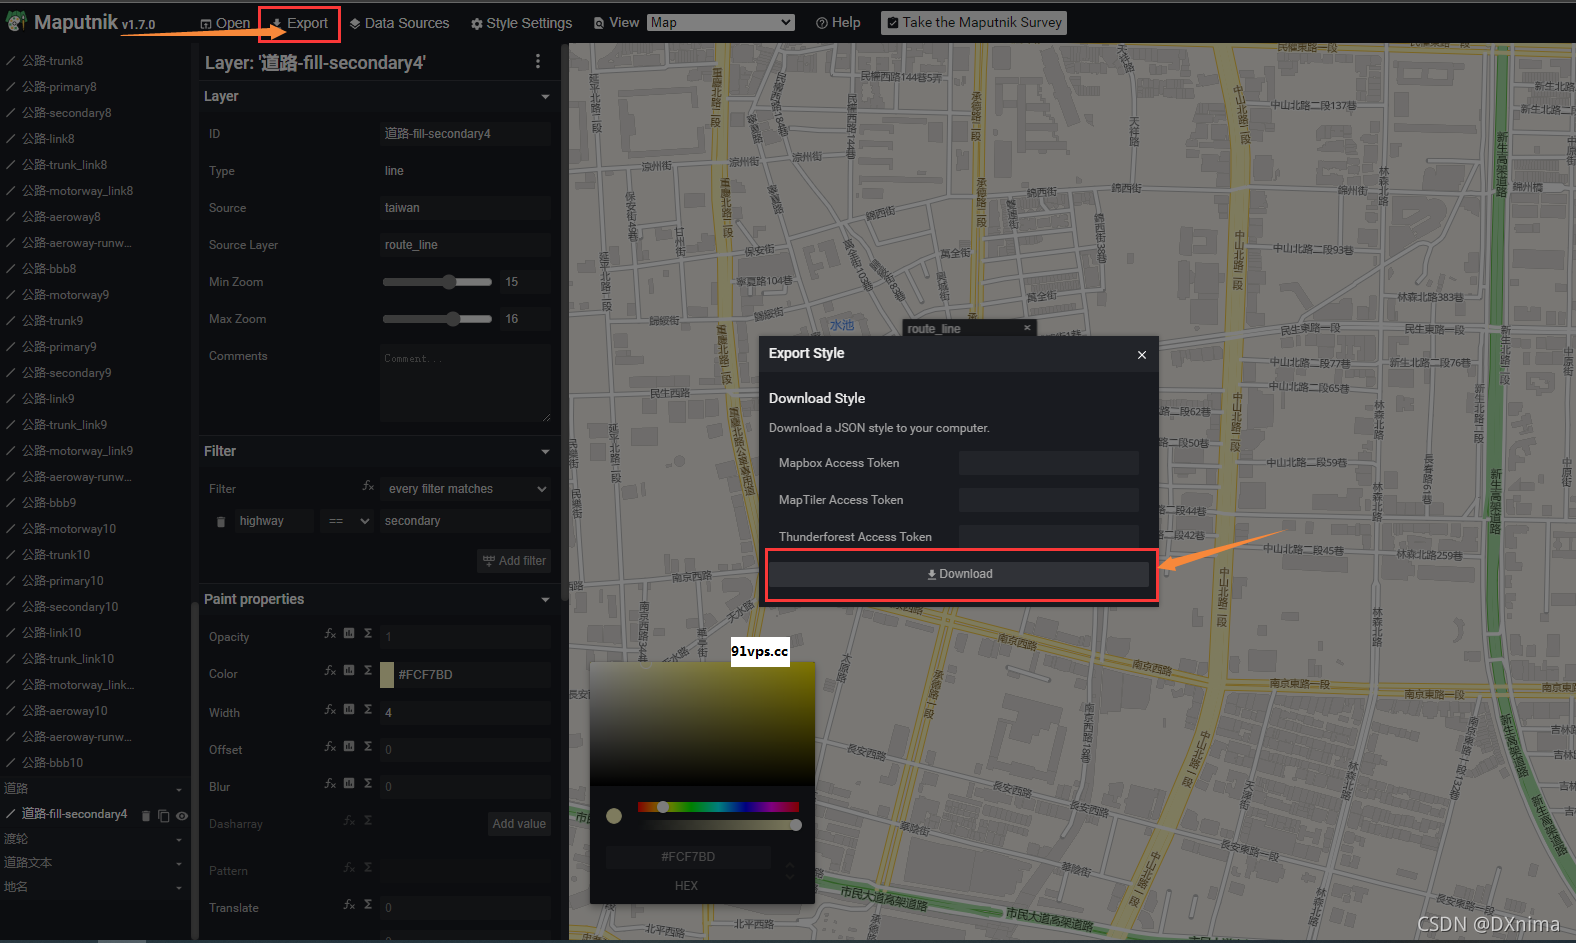 ## 2.分离不同图层样式 maputnik导出的json文件包含了所有的图层样式,将不同图层样式单独分离出来,方便导入Geoserver中,以building图层为例,在layers数组中找到**"source-layer": "building"**的样式,放入下面模板中: ```javascript { "version": 8, "name": "Taiwan Liberty", "metadata": {"maputnik:renderer": "mbgljs"}, "center": [120.679882, 24.143171], "zoom": 4, "sources": { "taiwan": { "type": "vector", "scheme": "tms", "tiles": [ "http://localhost:8080/geoserver/gwc/service/tms/1.0.0/taiwan%3Ataiwan@EPSG%3A900913@pbf/{z}/{x}/{y}.pbf" ], "minZoom": 0, "maxzoom": 24 } }, "sprite": "https://maputnik.github.io/osm-liberty/sprites/osm-liberty", "glyphs": "https://api.maptiler.com/fonts/{fontstack}/{range}.pbf?key={key}", "layers": [ //分离的图层样式粘贴放在这里! ], "id": "taiwan_liberty" } ``` 最终分离样式文件如下: ```javascript { "version": 8, "name": "Taiwan Liberty", "metadata": {"maputnik:renderer": "mbgljs"}, "center": [120.679882, 24.143171], "zoom": 4, "sources": { "taiwan": { "type": "vector", "scheme": "tms", "tiles": [ "http://localhost:8080/geoserver/gwc/service/tms/1.0.0/taiwan%3Ataiwan@EPSG%3A900913@pbf/{z}/{x}/{y}.pbf" ], "minZoom": 0, "maxzoom": 24 } }, "sprite": "https://maputnik.github.io/osm-liberty/sprites/osm-liberty", "glyphs": "https://api.maptiler.com/fonts/{fontstack}/{range}.pbf?key={key}", "layers": [ { "id": "其他-建筑物", "type": "fill", "source": "taiwan", "source-layer": "building", "minzoom": 15, "maxzoom": 24, "filter": ["all", ["!=", "building", "ferry"]], "paint": { "fill-color": "#DCD9D6", "fill-outline-color": { "base": 1, "stops": [[13, "hsla(35, 6%, 79%, 0.32)"], [14, "hsl(35, 6%, 79%)"]] } } }, { "id": "水域-建筑物", "type": "fill", "source": "taiwan", "source-layer": "building", "minzoom": 13, "maxzoom": 24, "filter": ["all", ["==", "building", "ferry"]], "paint": { "fill-color": "#DCD9D6", "fill-outline-color": { "base": 1, "stops": [[13, "hsla(35, 6%, 79%, 0.32)"], [14, "hsl(35, 6%, 79%)"]] } } } ], "id": "taiwan_liberty" } ``` ## 3.将Mapbox样式导入Geoserver 新建样式: 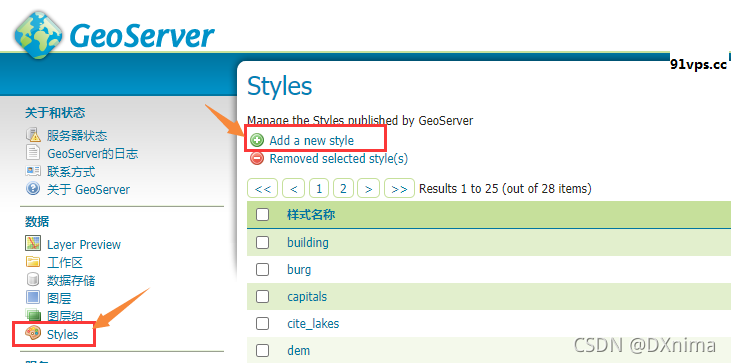 选择MBStyle,粘贴上一节分离的building样式文件,**Validate**检测一下正确性后保存: 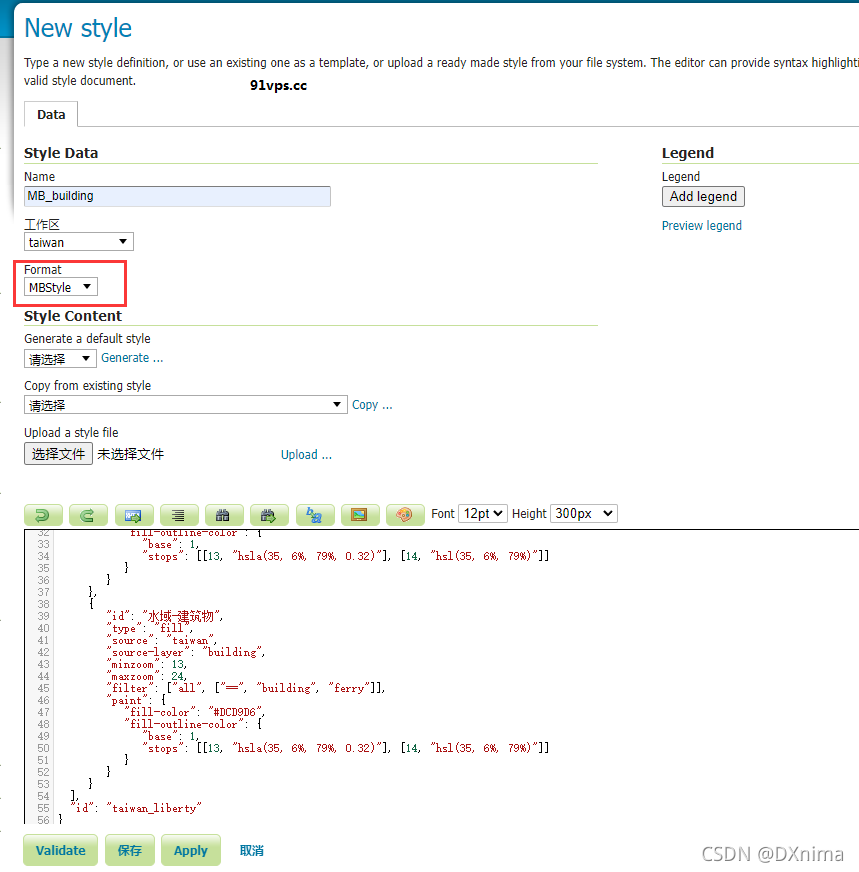 ## 4.查看转换后的SLD文件 上一步新建MB\_building样式保存完成后,在**.../webapps/geoserver/data/workspaces/** **taiwan/styles**中可以找到SLD文件: 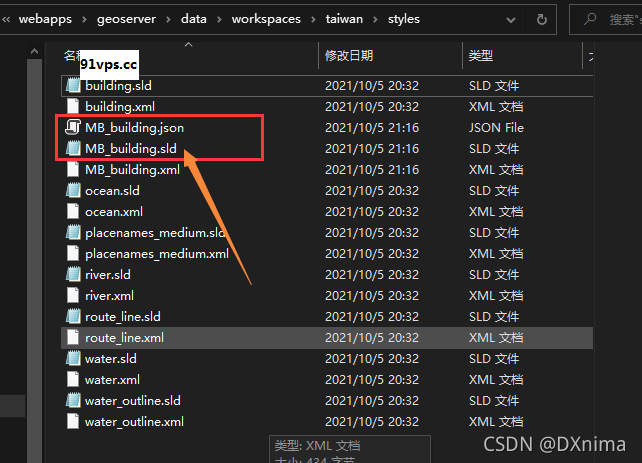 **提示**:如果没有看到对应的sld文件,可能是新建样式选错了工作空间或使用了默认工作空间,在其他文件夹里找;或者需要打开样式文件预览一下才会生成sld文件。 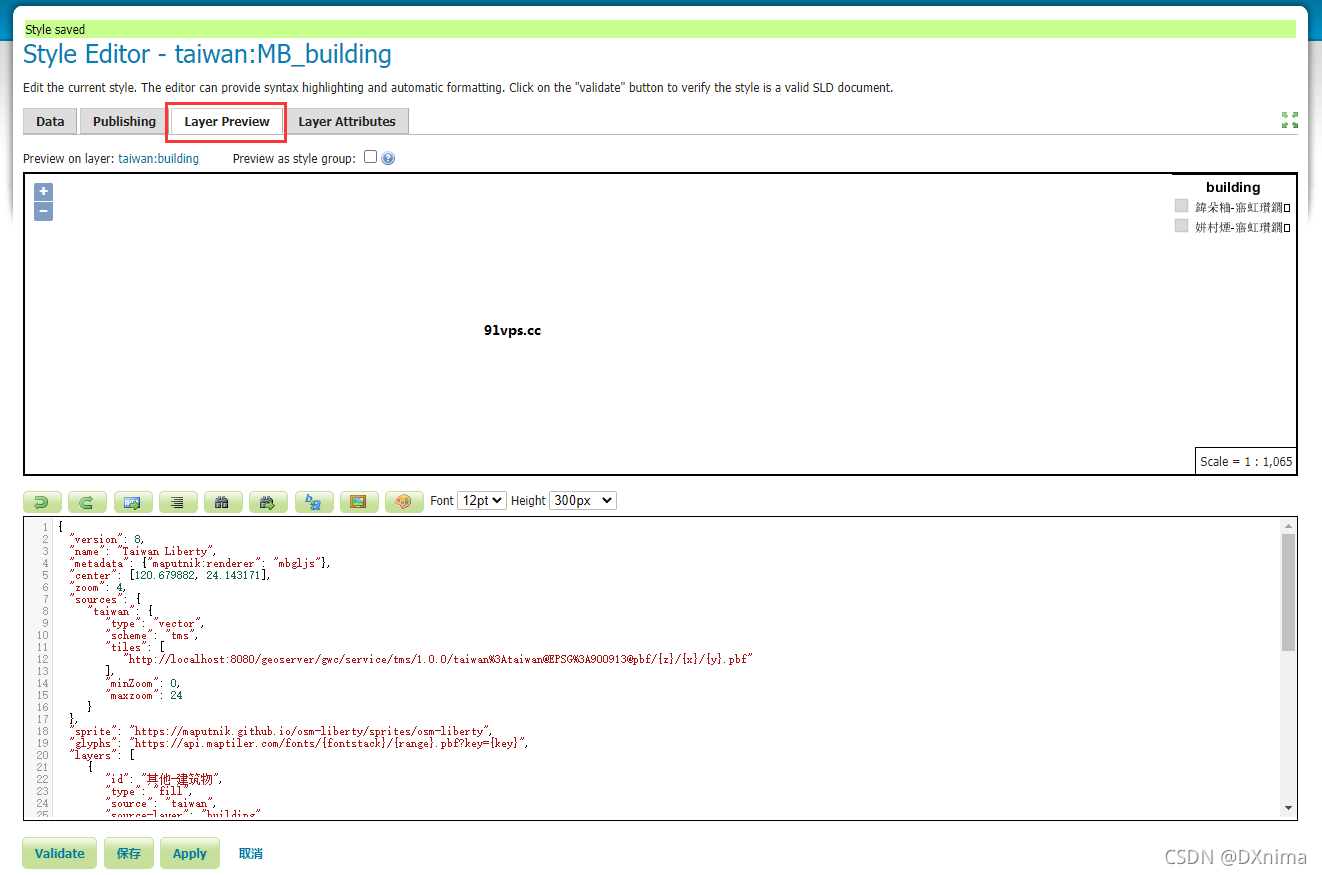 ## 五、总结 目前来看Mapbox提供的技术是最好用的开源自定义样式编辑解决方案,maputnik是基于Mapbox规范实现的开源的轻量级样式编辑工具,Mapbox官方样式编辑工具是[Mapbox Studio](https://studio.mapbox.com/ "Mapbox Studio")。 安装MBStyle Styling插件已经支持了Mapbox样式文件,为什么要多此一举转为SLD文件?从转入过程可以发现Geoserver支持的样式格式只有SLD文件,使用插件也是转为SLD文件在使用,这样转换后可以将SLD文件导出在其他环境中使用,比如生产环境,其他Geoserver服务器中;另一方面我一直在寻找[SLD转Mapbox Style工具](https://github.com/Norkart/SLDexit "SLD转Mapbox Style工具")方便已经存在的SLD样式能供Mapbox使用、Mapbox Style转SLD工具方便已经存在的MB样式供Geoserver使用,这样能更高效使用,如调节一套样式多平台上使用。 最后更新于 2023-05-23 16:49:00 并被添加「」标签,已有 2584 位童鞋阅读过。 本站使用「署名 4.0 国际」创作共享协议,可自由转载、引用,但需署名作者且注明文章出处
此处评论已关闭